Ask Grok Bot How Your Site Is Doing
Connect Grok Bot to Agent Analytics with one prompt, ask how your site is doing in chat, and get a daily summary on a Mission Control Page.
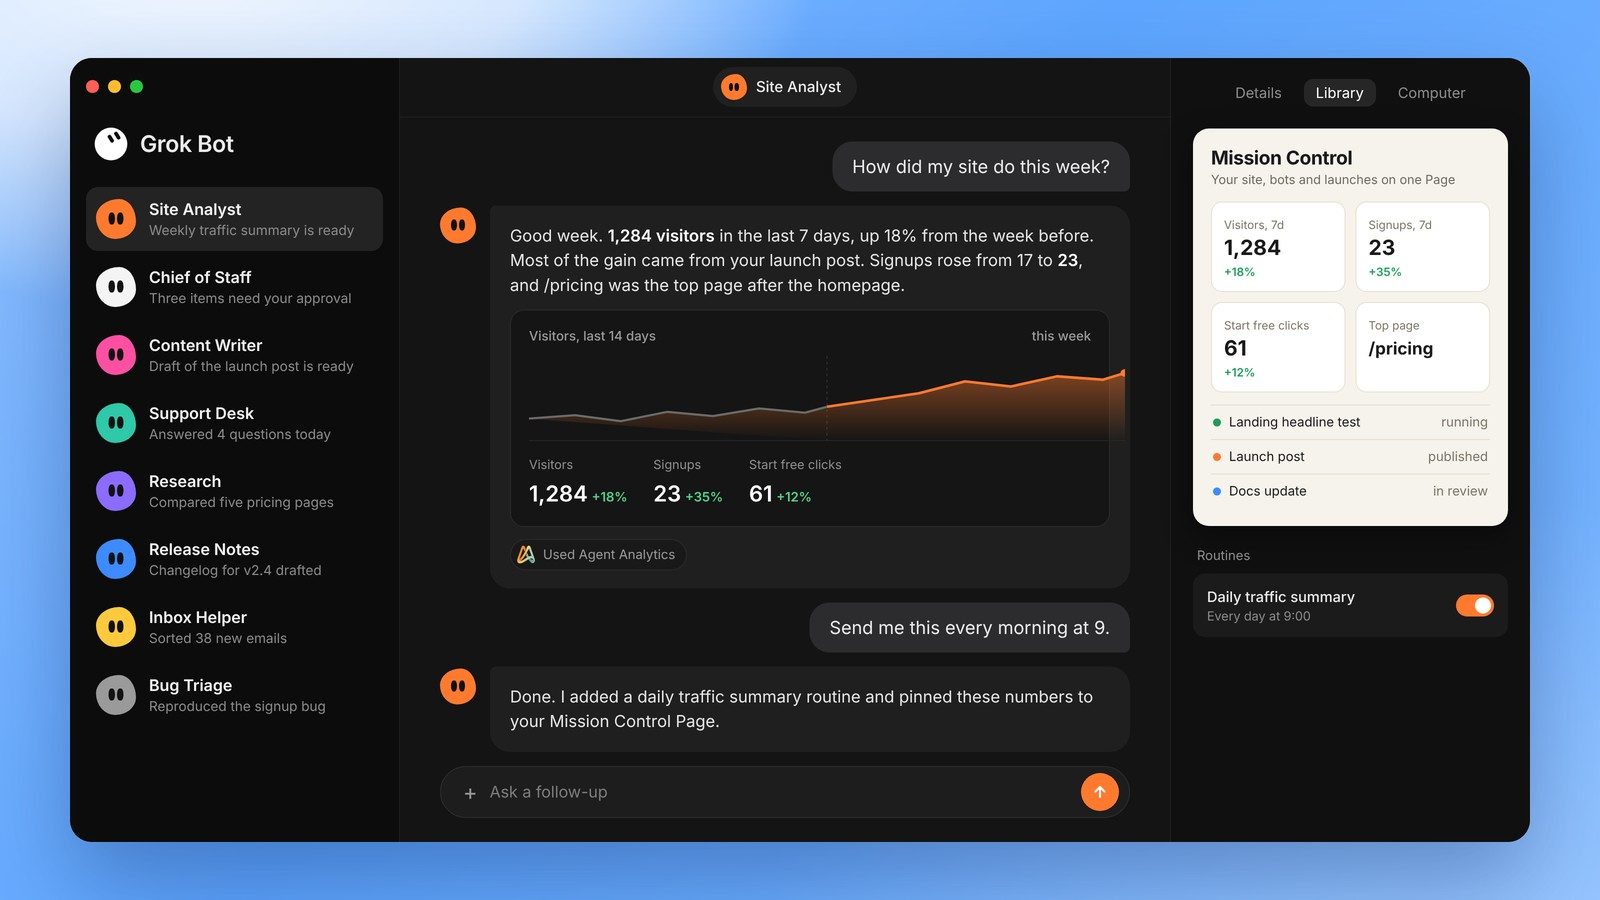
If you already talk to Grok Bot about your work, your site numbers can live in the same chat. You ask how the week went, it reads your Agent Analytics project and answers in a few lines. You can ask a follow-up right away, set the question to run every morning, or put the numbers on a Page next to everything else your bots are doing.
This post covers the prompt to start, the questions worth asking, a daily summary, and a Mission Control Page. Setup details and troubleshooting are in the Grok Bot guide in our docs.
TL;DR: paste this into Grok Bot
Connect the Agent Analytics MCP server at https://mcp.agentanalytics.sh/mcp. When it asks me to sign in, wait for me. Then list my Agent Analytics projects, pick the one with the most traffic this week, and tell me how it did over the last 7 days compared with the 7 days before: visitors, top pages, top referrers, and anything that changed a lot.Grok Bot shows a connect card the first time it uses an Agent Analytics tool. Sign in with the Google or GitHub account that owns your projects. There is no API key to copy.
Agent Analytics is not in the Grok Bot Connect Apps catalog. Grok Bot connects to it by URL when you ask in chat, as in the prompt above. You need an Agent Analytics account with at least one project that receives events.
Why ask in chat
A dashboard shows every chart, and you work out which one matters. In chat you start from the question you have: did the launch post bring signups, which page do people leave from, is the new headline ahead. The answer comes back as a sentence plus the few numbers behind it, and the next question builds on it.
It also puts the numbers where the decisions happen. If Grok Bot is already where you review PRs, approve drafts and run routines, checking traffic there saves a trip to another tab.
Questions to ask
Replace my-site with a project name from your list.
Traffic
How is my-site doing this week compared with last week?Which countries do my-site visitors come from this month?Who is on my-site right now?Give me a 7 day summary across all my projects.
Pages and sources
What are the top pages on my-site in the last 30 days?Which pages do visitors land on first, and which ones have the highest bounce rate?Which referrers and UTM sources brought the most visitors this week?How much bot traffic did my-site filter out this week?
Funnels and experiments
Build a funnel for my-site from page_view to signup. Where do people drop off?Which entry pages lead to a signup in the same session?List the experiments on my-site and tell me which variant is ahead.
Grok Bot uses the event names your project already sends. If you are not sure what they are, ask Which events does my-site track? first. Write actions, such as creating an experiment, wait for your approval.
Here is the kind of answer to expect. The numbers are made up.
my-site, last 7 days vs the 7 days before
- Visitors: 412, up from 355 (+16%)
- Top pages: / (198), /pricing (74), /docs/install (51)
- Top referrers: google.com (120), news.ycombinator.com (64), direct (90)
- Change worth a look: /pricing visitors rose 40%, but signups stayed at 9
Get a daily summary
Grok Bot can run a saved prompt on a schedule as a routine. Ask it to set one up:
Every weekday at 9:00, check Agent Analytics for my-site. Compare the last 24 hours with the same day last week: visitors, signups, top 3 pages, and top 3 referrers. Flag any page or source that moved more than 30%. Keep it to five lines. If nothing changed much, say so in one line.To change the time, the project or the metrics later, ask Grok Bot to edit the routine. For every project at once, ask for a summary across all of them.
A daily message could look like this. The numbers are made up.
my-site, yesterday vs last Tuesday
Visitors 61 (was 48). Signups 2 (was 2).
Top pages: /, /pricing, /blog/launch
Top referrers: direct, google.com, x.com
Moved: x.com referrals up from 3 to 14
Put your numbers on a Mission Control Page
Grok Bot can also build Pages: web pages you open in a browser, which a routine can rebuild on a schedule. Awesome Grok Bot Pages lists Page templates, each with the prompt that builds it and an optional routine prompt that keeps it updated. Three of them fit site analytics.
Side Project Mission Control is one screen for a product you run with bots. It has a status strip for site, deploy, PRs and errors, a ranked Needs you list with copy buttons for your reply, a shipping queue and a bot activity feed. Its prompt asks for your analytics, for example the Agent Analytics MCP, to show visits, signups and clicks on your main call-to-action, each with a sparkline and the change against the 7-day average. Its routine prompt refreshes the Page every weekday at 8:30 AM and messages you only if the site is down or a deploy failed.
To set it up:
- Connect Agent Analytics with the prompt at the top of this post.
- Open the template, copy its prompt and paste it into Grok Bot.
- Tell Grok Bot which project to use and which event is your call-to-action click.
- Copy the routine prompt from the same template so the Page stays current.
Mission Control is Alex Finn’s prompt for a dark dashboard of all your bots: an office view of who is working, what waits on you, an activity timeline, upcoming routines and an activity heatmap. Its top bar has 3 to 5 stat cards for numbers you choose from your connected accounts. If you already run this Page, add your site numbers to it:
Add a site traffic section to my Mission Control Page. Pull visits, signups, and clicks on my signup button for my-site from Agent Analytics for the last 14 days, each with a sparkline and the change against the 7-day average. Show anything Agent Analytics does not track as empty instead of guessing. Update it every time the Page refreshes.Site Analytics Dashboard is a Page about your sites alone, built from Agent Analytics data for the last 30 days. It shows visits, signups and landing to call-to-action conversion, daily visits per site with a 7-day average, weekly signups, a landing to signup funnel, and up to 3 suggested next steps with Copy yes and Copy no buttons. Its prompt connects the Agent Analytics MCP first if it isn’t connected, and its routine refreshes the Page every day at 8:00 AM.
All three prompts tell Grok Bot to show missing data as empty instead of guessing. Keep the Page with your real numbers private. If you want to share yours, the templates suggest making a copy with mock data and making that copy public.
We wrote the Side Project Mission Control and Site Analytics Dashboard templates. Mission Control comes from Alex Finn’s post on X.
Next steps
- Setup and troubleshooting: Ask Grok Bot how your site is doing and Connect to Grok Bot
- No project yet: Your first project
- Running tests from chat: AI Agent Experiment Tracking