🦞 Why We Built Live Monitor for macOS
We wanted a faster way to watch live traffic, QA trackers, and keep a wallboard open without living in a dashboard tab.
Most analytics products assume the same workflow:
Open a browser tab. Leave it on a dashboard. Refresh it when you want to check if something changed.
That works fine for historical reporting. It is much worse for the kind of work I kept doing with Agent Analytics.
I wanted a live surface I could leave open while shipping. Something I could glance at during a launch, during tracker QA, or while debugging a strange spike. I did not want that job competing with docs, admin panels, deploy logs, and the ten other tabs already open in the browser.
That is why we built Live Monitor for macOS.
The Browser Tab Was Doing the Wrong Job
The problem was not “I need another dashboard.”
The problem was that live monitoring is a different activity from analysis.
When I am checking last week’s top pages, I am happy in the web app. When I am trying to answer questions like “did the tracker fire?”, “which country is active right now?”, or “did that launch announcement just move traffic?”, I want a persistent screen I can keep nearby without burying it in the browser.
The browser tab kept getting reused for the wrong thing:
- a temporary wallboard during launches
- a QA surface while testing page views and custom events
- a second screen during customer demos
- a quick pulse-check while coding
Those jobs all want the same thing: fast, glanceable, live information.
Desktop felt like the right surface for that.
Why Desktop
I wanted the live monitor to feel more like an instrument panel than a dashboard.
Open it once. Leave it running. Pick a project. Look over when you need signal.
That led us to a small macOS app that focuses on one project at a time and stays opinionated about what belongs there:
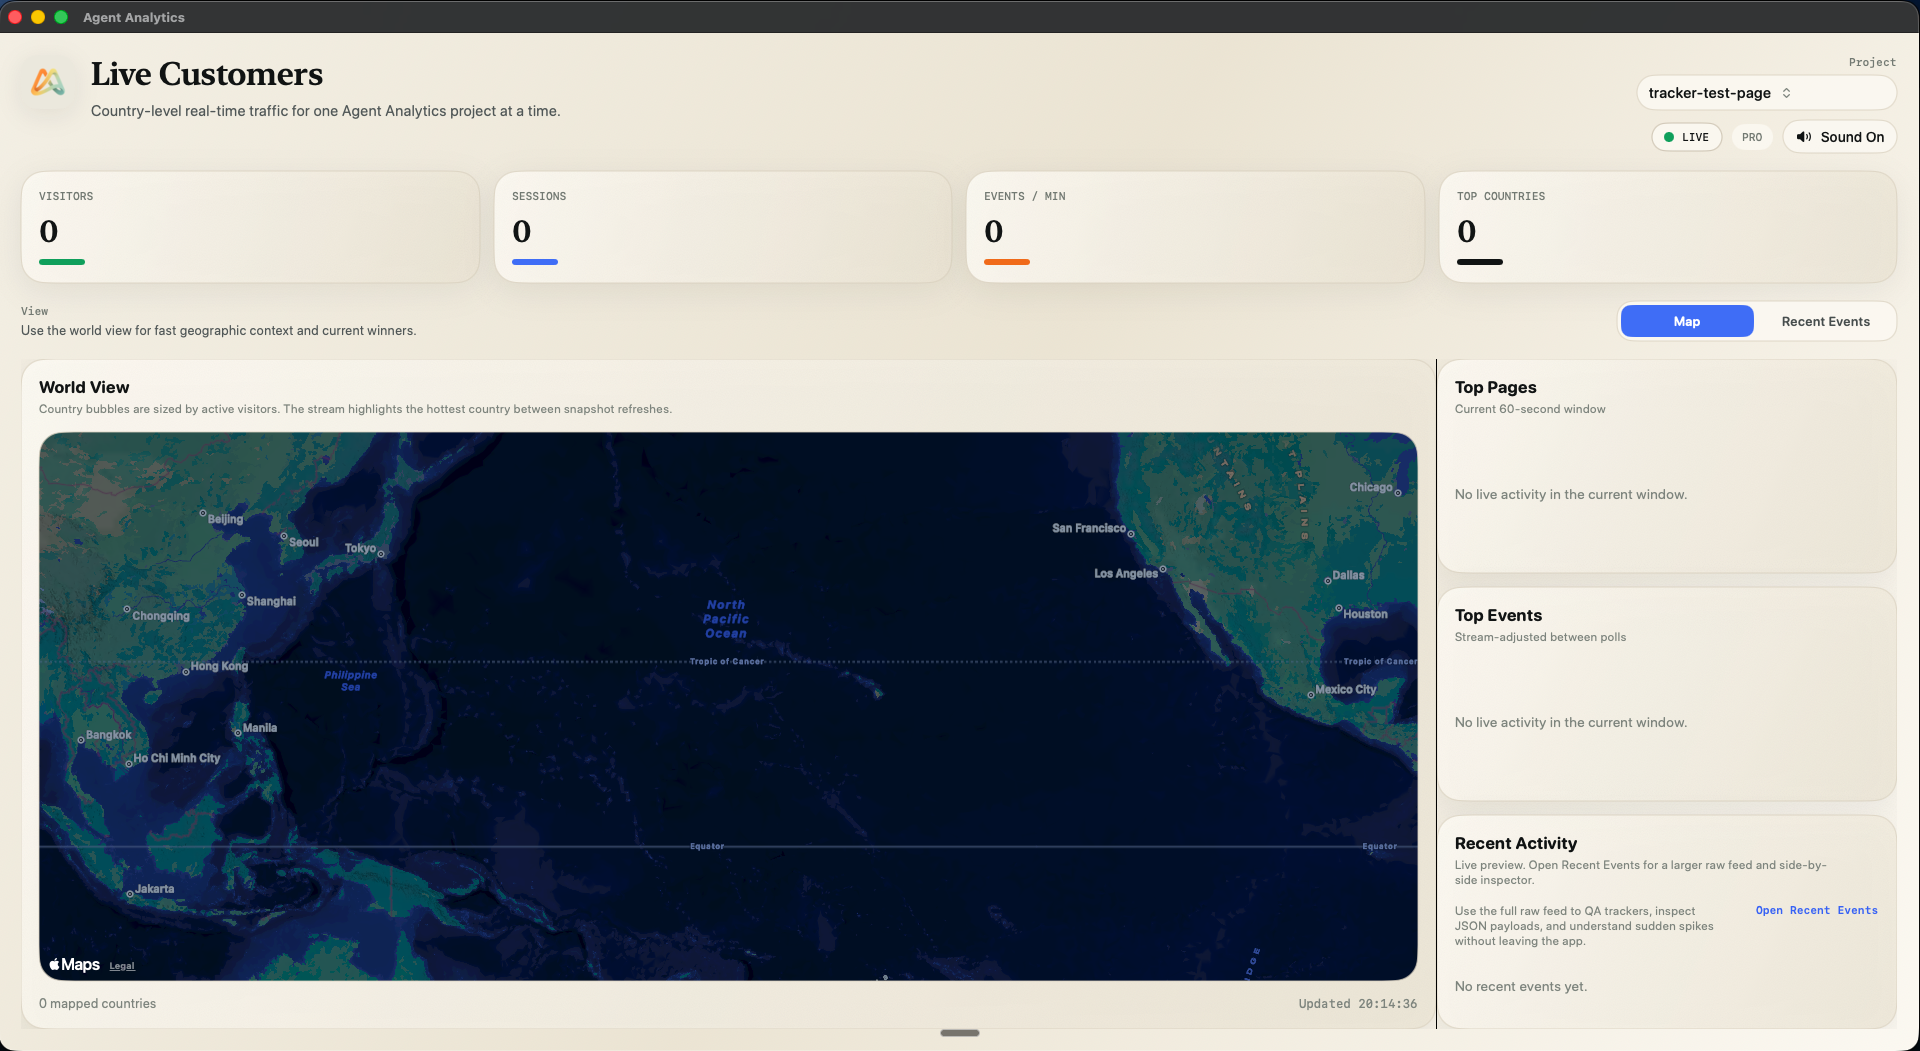
- a country-level live map
- the current top pages
- the current top events
- a raw recent-events feed for inspection
- connection diagnostics when
/liveor/streammisbehave
It is not trying to replace the full web app. It is giving live traffic its own surface.
What the App Does Right Now
The current app is intentionally narrow.
You sign in with your existing Agent Analytics account access, choose a project, and the app opens into a live view built for monitoring rather than deep reporting.
On the main screen you get:
- a project picker
- live visitor, session, and events-per-minute cards
- a world view with country-level activity
- top pages and top events for the current live window
- a recent activity preview
Under the hood, the app combines /stream for immediate activity with /live polling for authoritative resync. That makes it useful both as a passive monitor and as a sanity-check tool when you are testing your instrumentation.
There is also a dedicated raw event explorer. That is the part I kept wanting during tracker QA: not just “traffic exists,” but the actual payloads, user/session IDs, countries, paths, and properties that explain why the live view changed.
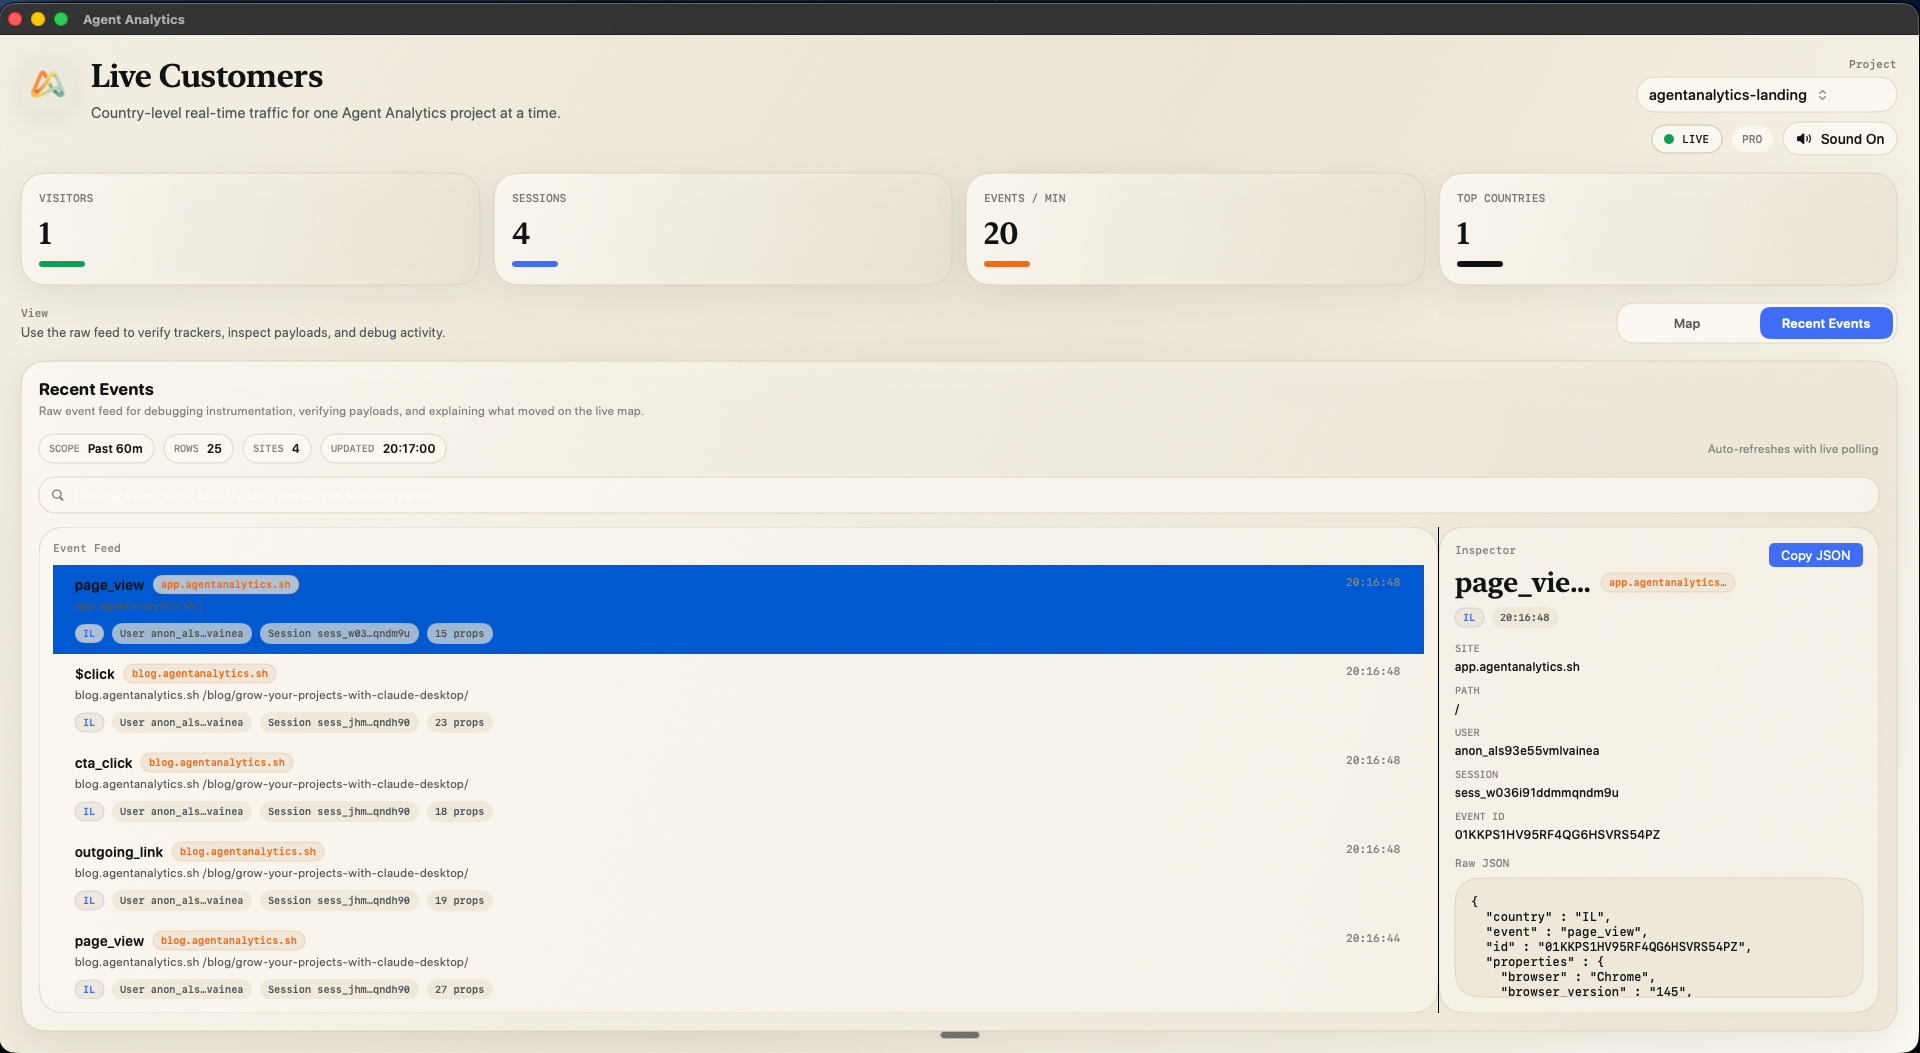
You can filter the feed, inspect the JSON side-by-side, and verify whether a CTA click, signup, or page view showed up the way you expected.
The app also has lightweight diagnostics for separating /live polling issues from /stream SSE issues, plus optional new-visitor sounds if you want a little more ambient feedback while it is open on another screen.
Why Current Users Care
I built this for people who are already using Agent Analytics and keep finding themselves in live mode.
That usually means one of four things:
- You are launching something and want a wallboard you can keep open.
- You are debugging tracker behavior and need raw events, not just aggregates.
- You want a customer-facing screen during demos or internal reviews.
- You want a low-friction pulse-check while building, without reopening the dashboard over and over.
That is also why the app does not start with twenty views and a big left nav. The value is in being focused. Open the app, keep it nearby, and let the browser stay for everything else.
Beta Reality
This is still a beta, and the limits are real:
- it is currently macOS-only
- it targets macOS 14+
- the downloadable build is currently unsigned / not notarized
- it relies on your existing Agent Analytics hosted account and API access
So this is not positioned as a polished general-purpose desktop analytics suite yet. It is a practical live monitor for current users who already know the product and want a better surface for this specific job.
I also do not want to hide the install friction. Because the app is not notarized yet, macOS will warn on first launch. The full Gatekeeper flow is documented on the download page, and that is the right place for the step-by-step install instructions rather than duplicating them here.
Available Now
If you already use Agent Analytics and this sounds useful, start here:
The download page includes the current beta notes and the exact macOS Open Anyway flow. Once the app is installed, you can connect with the same API access you already use in the hosted product or via the CLI config if you are already logged in there.
This is one of those products that became obvious only after using Agent Analytics every day. The web app is still where I go for broader analysis. But for live traffic, tracker QA, and keeping a project’s pulse visible while I ship, a dedicated desktop screen is simply better.
Read next: How We Started Agent Analytics