Grow Your Projects from Claude Desktop
Use Claude Desktop as a growth agent to query analytics, spot bottlenecks, run experiments, and iterate without leaving your chat.
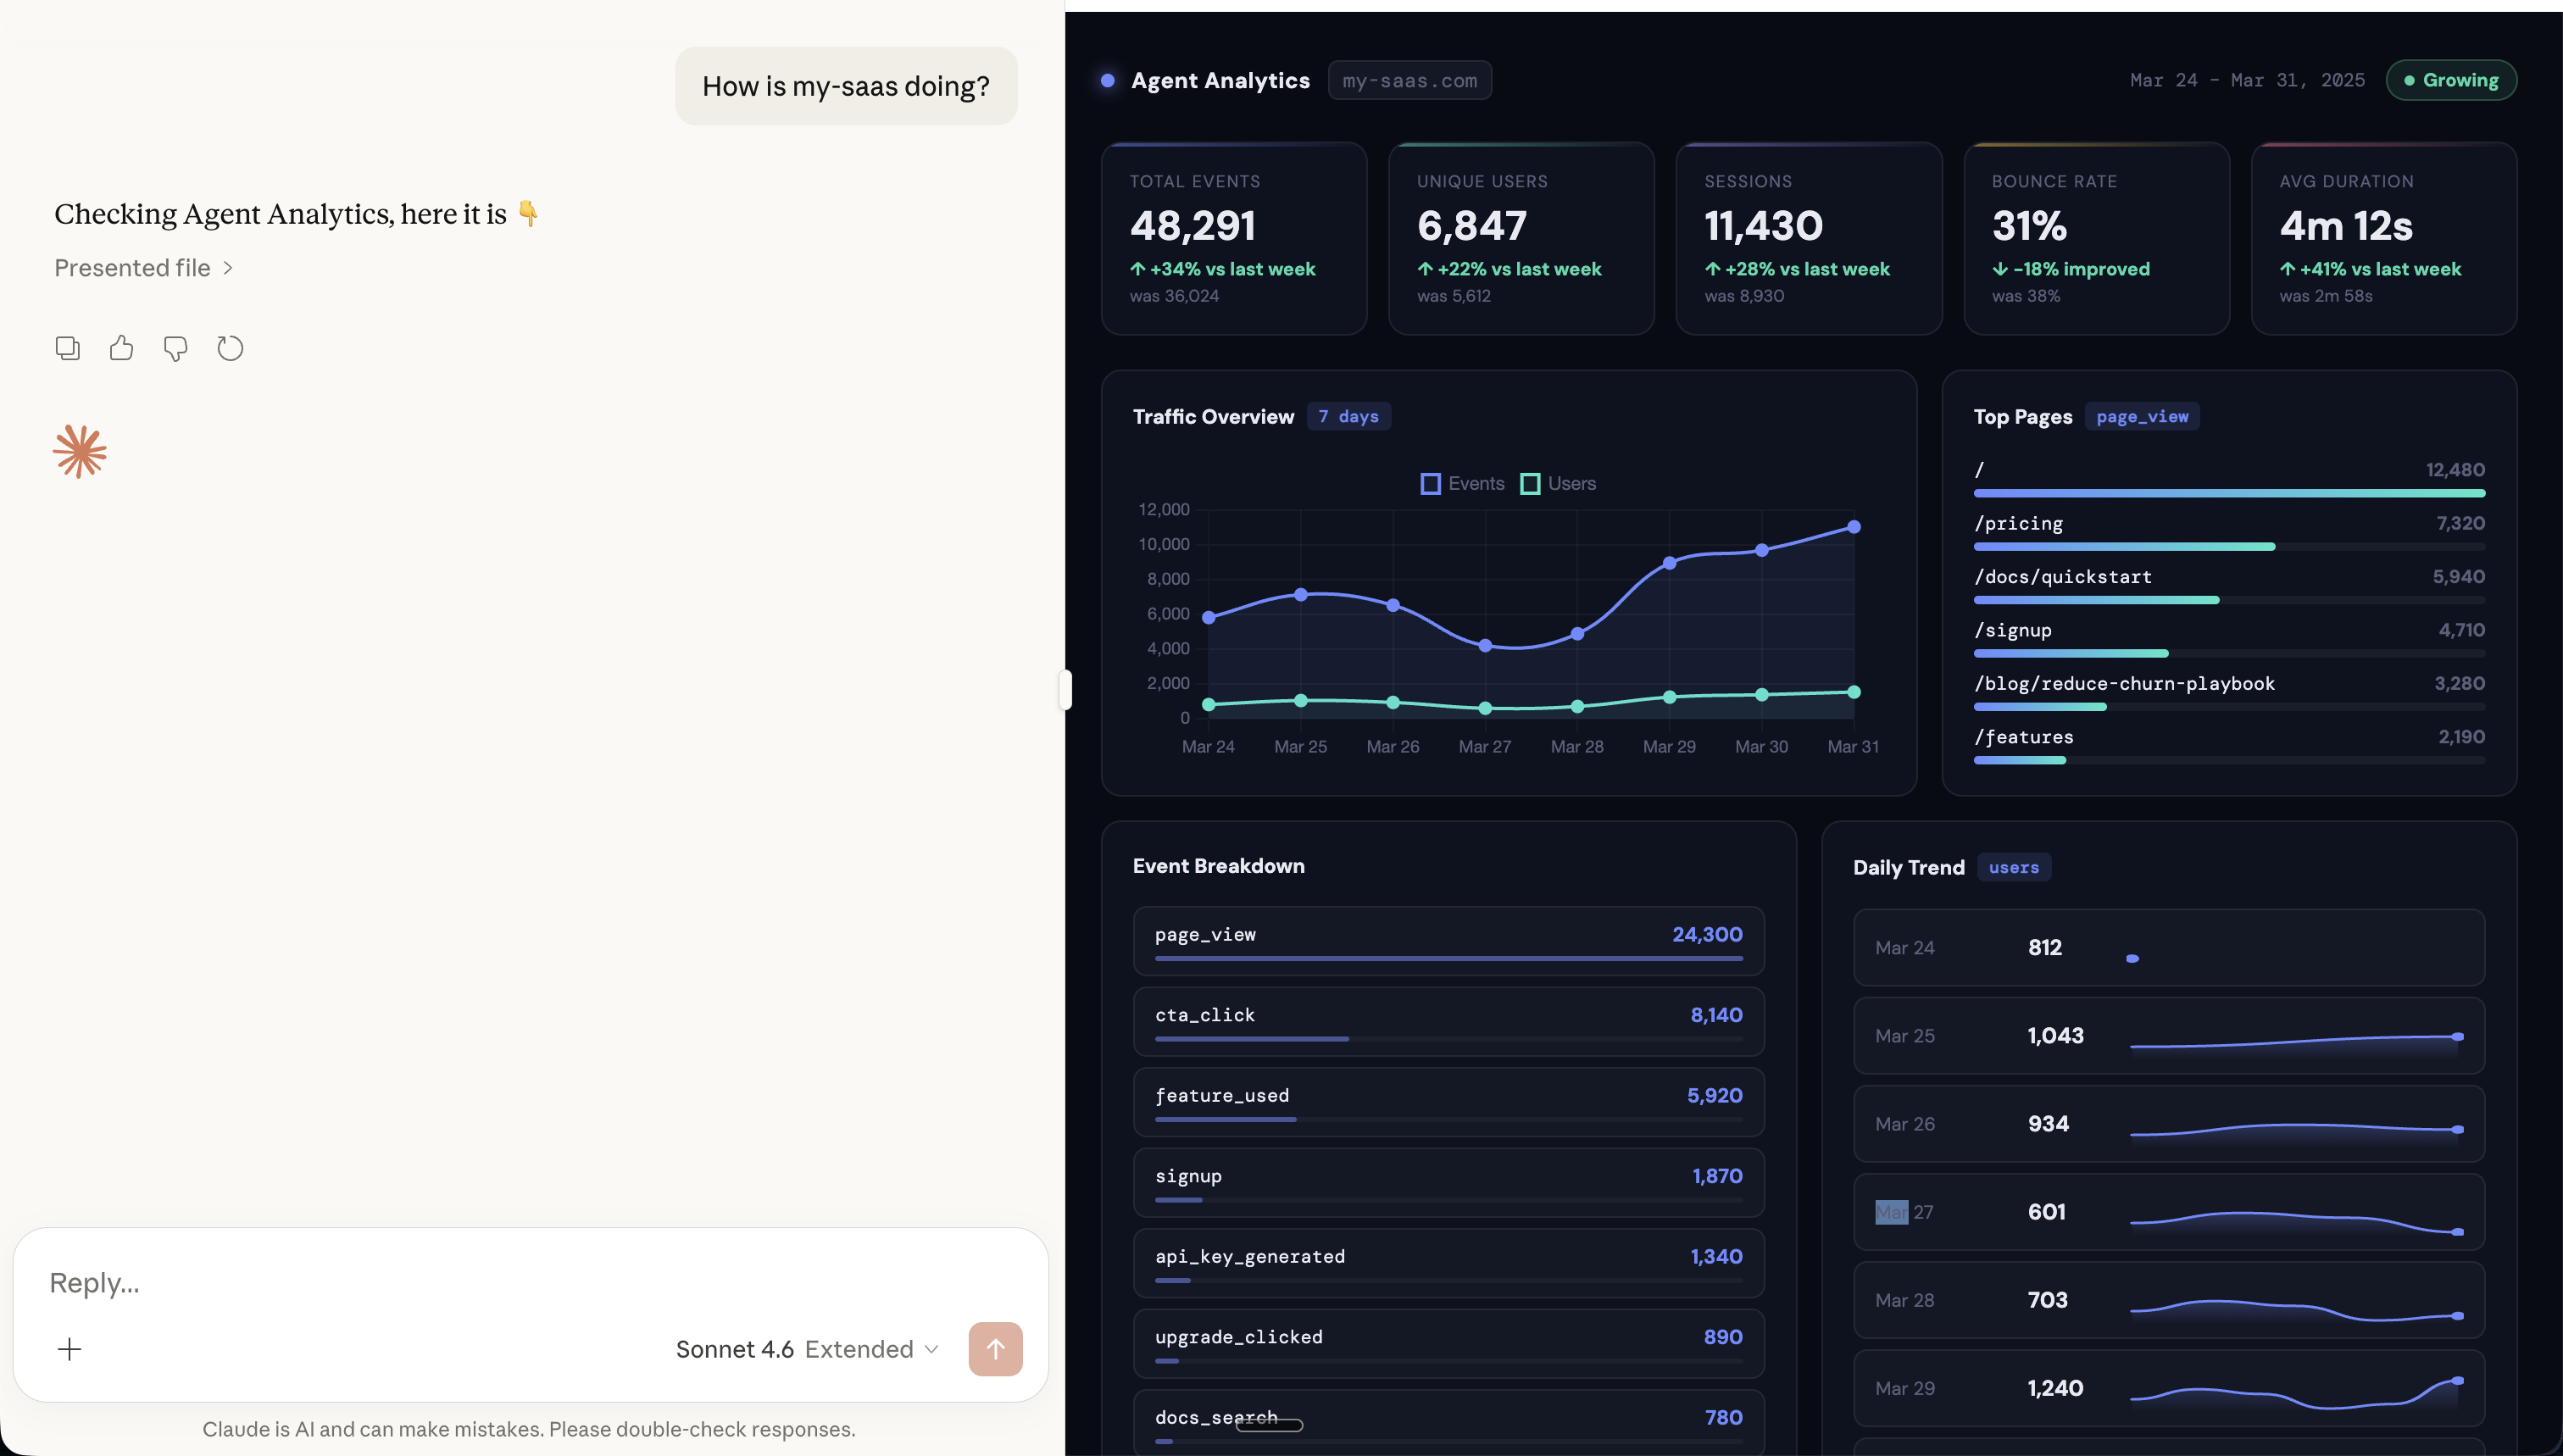
You type “How is my-saas doing?” into Claude Desktop.
Ten seconds later, you’re looking at a full analytics dashboard — charts, trends, event breakdowns — rendered right inside the conversation. No browser tab. No dashboard login. Just a question and an answer.
This is what happens when you connect Agent Analytics to Claude Desktop via MCP.
MCP-UI: Analytics That Render in Your Chat
Agent Analytics supports MCP-UI — the emerging standard for rich UI components in MCP tools. When Claude queries your analytics, it doesn’t just return text. It renders:
- Traffic charts — events and users over time, right in the conversation
- Top pages — ranked by page views with visual bars
- Event breakdowns — page_view, cta_click, signup, feature_used — all at a glance
- Daily trend — user activity day by day
- KPI cards — total events, unique users, sessions, bounce rate, avg duration — with week-over-week deltas
MCP-UI renders secure, sandboxed HTML components inline. It works with any MCP host that supports the standard — Claude Desktop, ChatGPT (via mcpui.dev), and more.
The result: you ask a question in natural language, you get a visual answer. No context switching. No dashboard tab.
The Growth Loop
Growing a product isn’t one action. It’s a loop:
Query → Hypothesize → Experiment → Iterate
Most people break this loop because each step lives in a different tool. Analytics in Mixpanel. Experiments in Optimizely. Code changes in your editor. Results back in Mixpanel. Context is lost between every step.
With Agent Analytics in Claude Desktop, the entire loop happens in one conversation — and with MCP-UI, you get real charts and visuals at every step.
Step 1: Query — “How’s my site doing?”
Start by asking Claude about your projects:
“How is my-saas doing?”
Claude queries your data via MCP and renders a full dashboard — visitors, trends, top pages, conversion rates. No tab switching, no dashboard login.
“Show me the funnel from page view to signup”
Now you see where users drop off. Maybe 500 people visit, 40 click your CTA, but only 2 sign up. The bottleneck is clear: CTA click → signup has a 95% drop-off.
Step 2: Hypothesize — “Why are they dropping off?”
This is where Claude shines. It has the data AND the context. Ask:
“Why do you think users click the CTA but don’t sign up?”
Claude can reason about it: maybe the signup form is too long, the CTA promise doesn’t match the landing page, or there’s friction in the flow. It suggests concrete hypotheses based on your actual data — not generic advice.
Step 3: Experiment — “Let’s test that”
Now turn the hypothesis into an experiment:
“Create an A/B test on my-site. Test the current signup CTA against ‘Start Free — No Credit Card’. Goal: signup event.”
Claude creates the experiment via the Agent Analytics API. It gives you the HTML to add the variant — just a data-aa-experiment attribute on your element. Declarative, no SDK:
<button data-aa-experiment="signup_cta"
        data-aa-variant-b="Start Free — No Credit Card">
  Sign Up
</button>
Deploy it. The experiment is running.
Step 4: Iterate — “Did it work?”
A few days later, check back:
“How’s the signup CTA experiment doing?”
Claude checks the results: Variant B converts at 4.2% vs control’s 2.1%. Statistical significance at 94%. Almost ready to call it.
“And check the funnel again — did the drop-off improve?”
The funnel shows CTA click → signup improved from 5% to 9%. Real progress.
“Ship variant B and let’s test the next bottleneck”
Claude completes the experiment, and you move to the next step in the funnel. The loop continues.
Why This Works
The power isn’t in any single step. It’s that all four steps happen in one conversation. Context flows naturally:
- Claude remembers your funnel data when suggesting hypotheses
- It knows which experiment is running when you ask for results
- It connects the dots between the A/B test winner and the funnel improvement
- It suggests the next thing to test based on everything it’s seen
No context lost between tools. No re-explaining. Just continuous iteration.
Setting It Up
Agent Analytics has an MCP server that works with Claude Desktop, Cursor, and any MCP-compatible client:
- Get your API key at agentanalytics.sh
- Add the MCP server to your Claude Desktop config — see our Claude Desktop install guide
- Start asking questions — Claude now has access to your analytics
That’s it. No skill installation needed for MCP — the server handles everything.
Works Beyond Claude Desktop
The same MCP server works with:
- Claude Desktop — full MCP support with MCP-UI for rich charts
- ChatGPT — via MCP-UI
- Cursor — query analytics while you code
- Claude Code / OpenAI Codex — via MCP
- Windsurf / Trae — via MCP
And for OpenClaw users, there’s a dedicated skill on ClawHub with even deeper integration.
The Full Picture
Here’s what your growth workflow looks like when everything is connected:
- Morning: “How are my projects doing?” → quick stats across all sites
- Spot something: “Show funnel for the pricing page” → 60% drop-off at checkout
- Hypothesize: “What could improve checkout conversion?” → Claude suggests shorter form
- Test: “Create an A/B test for checkout” → experiment is live in minutes
- Next morning: “Check the checkout experiment” → variant B is winning
- Ship & repeat: “Ship it and what should we test next?” → Claude suggests the next bottleneck
Every day, your projects get a little better. No dashboards. No context switching. Just conversation.
Get Started
- Sign up at agentanalytics.sh
- Claude Desktop install guide at docs.agentanalytics.sh
- MCP-UI at mcpui.dev — rich UI components for MCP
- Open source on GitHub
Previously: Funnels: See Where Users Drop Off · A/B Testing Your AI Agent Can Actually Use · Set Up Agent Analytics with OpenClaw